

THE LYONS EDGE • MARKET LAB
SEASONALITY IN SPORTS CARDS
What a 60 Day Price Change Can and Cannot Tell You

Don’t rush to sell your Jordan or Brady cards solely because a headline says the market is down.
I wrote this because I am hearing respected voices in the hobby report that legacy-player cards are down. When collectors hear “Jordan is down” or “Brady is down,” I want them to pause before turning that headline into a selling decision.
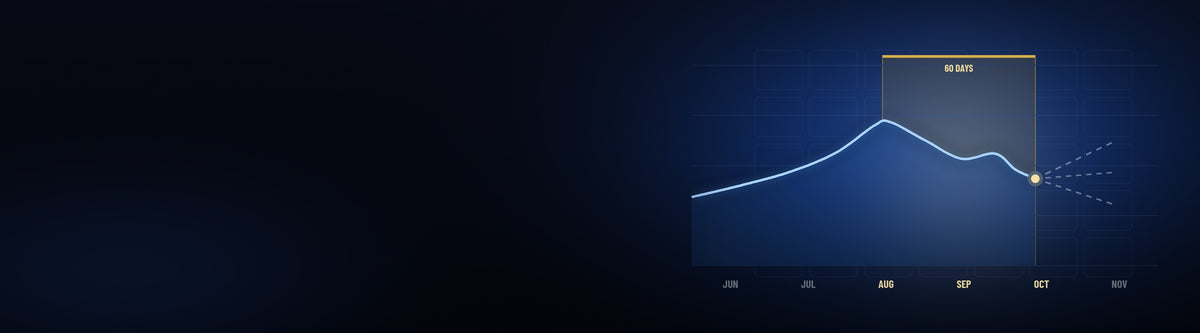
The people reporting a decline may be accurately describing their data. But that number alone does not tell you what your exact card is worth today, why its price changed, or what happens next. A 60-day decline can reflect a broader correction, player news, a recurring demand window, or a change in the cards being measured. At Lyons Cards, we want the context before the conclusion.
What hotel revenue management teaches us
My background in hotel revenue management shapes how I look at card pricing. I would not judge a hotel’s health from a single month-to-month percentage without asking what normally happens during that period. We should bring that same discipline to sports cards.
First, understand the market’s demand calendar. Cape Cod’s tourism organization describes a summer-oriented destination with quieter shoulder seasons. New York City has a different mix of demand, but its tourism organization also documents seasonal peaks and relative lows. Neither market should be judged against the other’s calendar, and New York is not continuously at 100% occupancy.

Cape Cod and New York City follow different demand calendars [5, 6].
That is the approach I want for cards: investigate the degree and timing of seasonal sensitivity for each segment. Some may show pronounced windows; others may show weaker or inconsistent patterns. We should measure those differences rather than assign every card the same seasonal label.
Consider a hypothetical summer-oriented hotel. Its room revenue falls from $100,000 in August to $85,000 in September: a 15% decline. That arithmetic is accurate. But it does not establish that the hotel is losing its competitive position or that October will fall another 15%.
Suppose the comparable September a year earlier produced $80,000. This September is then up 6.25% year over year, even while it is down 15% from August. Both statements are true. We would still examine several years, comparable dates and events, room availability, occupancy, average daily rate and competitors before deciding whether performance is healthy.

Hypothetical hotel revenue: September is down from August but up from the previous September. Both comparisons are accurate.
Now suppose our operating forecast expected September to be down 25%. An actual 15% decline would be better than expected. Reverse it: a 5% increase can disappoint if a well-supported forecast called for 20%. Those are hypothetical hotel examples, not measured card-seasonality estimates. The lesson is to ask what we should reasonably compare the result with—and why.
The problem is not reporting the decline. The problem is treating the decline as a complete explanation or a forecast. September is not automatically a weak month for every hotel; the relevant demand calendar depends on the market. The same care belongs in card research.
The analogy also has a limit. Hotel room revenue combines price and rooms sold; a card-price index is a different measure. We must separate card prices from transaction counts and total sales dollars. And unlike an unsold room night, a card can remain in inventory—while tying up cash and carrying the risk that demand or price falls further.
First check the source
In an October 14 episode of The Geoff Wilson Show, Geoff Wilson reported roughly 60-day declines of 12% for Tom Brady, 6% for Michael Jordan and 4% for LeBron James. These are his reported figures, not independently reconstructed returns. The episode did not supply enough detail about card selection, exact dates or calculation method to reproduce them.

Roughly 60-day changes as reported on The Geoff Wilson Show, October 14, 2026. Reported figures, not independently reproduced.
Wilson also discussed seasonal slowing and distinguished common iconic cards from scarcer material. He remained optimistic about the longer term. That is a more useful starting point than assuming the commentary was a call to panic.
Ask the same-period question
If a card or player index is down from mid-August to mid-October, compare that same window across several complete years. Then ask how it performed relative to a suitable market benchmark. A decline that repeats during that window may be consistent with seasonality; a decline that is unusual for that window needs a different explanation. Neither conclusion comes from one chart alone.
Look at individual years, including corrections and exceptional booms. Check whether the same exact cards and grades were measured each time. A basket that changes membership can make a familiar-looking seasonal comparison less meaningful.
Our preliminary study covers January through December in both 2024 and 2025: seven exact card-and-grade series, six players and 2,775 recorded-sale observations. Five series traded often enough for regular monthly comparisons. Their August medians rose in both years, which challenges a blanket claim that these cards necessarily weaken as football approaches. September and October were mixed. Two years do not establish a dependable seasonal rule, and a shared market rise could explain part of the pattern. We still need a matched broad-market comparison and additional years.

Monthly median changes for five frequently traded exact-card series. Both years are shown separately; these are not investor returns or a proven seasonal forecast.
These charts follow the same card issue and grade through time, but the physical copies sold are different. Eye appeal, sale format, venue and other differences can still affect the monthly median. The Griffey check shows the problem: July-to-August 2024 was slightly positive across recorded formats and slightly negative in auction-only records. A small result can change when the sample changes.
Seasonality is a question we can test
Our hypothesis is straightforward: summer travel, school expenses and the opening of football may change what collectors pay attention to and what they can spend. That is plausible. It is not yet a demonstrated explanation for this decline.
Consumer surveys confirm that school shopping stretches across the summer. But those surveys do not identify the collectors buying Brady or Jordan, and a family’s school budget does not tell us what a high-end collector paid at auction. To establish the connection, we would need evidence about purchasing behavior as well as prices.
The historical evidence we could access also gives us reasons to be careful. A supplementary public index showed football gains in August in each of four years, 2022 through 2025. September was split between gains and losses. Basketball’s August readings were positive in all four years too.
That is a research lead, not a trading calendar. The index does not disclose its full card basket or monthly sale counts, and it emphasizes established and retired stars. It cannot prove that active football gained at the expense of legacy cards. One basketball month had an unusually large jump, which makes an average especially sensitive to the sample.
The release calendar competes for attention too
The sports calendar is only part of the picture. New products, new designs and new chases arrive while collectors are deciding what to buy. A buyer considering an older Brady card might instead spend on a new Josh Allen card, a Bowman prospect or a sealed box. That is a plausible purchasing choice—not evidence that most buyers made it or that Brady’s measured decline resulted from it.
The timing is relevant in this particular 2026 window. Topps lists Flagship Football as available from August 21 and Bowman Football from September 30. Topps Flagship Basketball opened for preorder October 6, with a stated October 22 street date. As of October 14, that basketball product belongs in the preorder and anticipation discussion, not in a claim that its full release had already occurred.

2026 release dates from Topps. October 22 is the stated street date for Topps Flagship Basketball.
These launches give us concrete events to investigate alongside the start of football. Purchases and preorders may compete for budgets, and release promotion may compete for attention. But the timing alone cannot show how much demand moved away from existing cards. A release can also attract additional buyers or generate interest in the same legends: Topps’ Flagship Football description includes both Josh Allen and Tom Brady.
What about the roughly 590 million cards figure? It must be labeled as an estimate. HobbyMonitor’s published model estimates about 529 million cards and cites a separate analyst’s estimate near 592 million. We have not independently reproduced either total or verified the second analyst’s original calculation. Neither figure is an official Topps production total established by this research.
Even a reliable total production estimate would not tell us how many cards were opened, listed or sold during those 60 days. Nor would it establish the supply of a particular scarce insert or autograph. The useful question is which new cards compete with the exact card we own, at what prices, and with what observed buyer activity.
Separate recurring seasonality from a release-specific supply event. A product launch tied to the calendar may amplify a seasonal window, but the scale or novelty of one year’s release may not repeat. Compare exact-card prices, sale counts and competing inventory before and after the launch, against prior-year windows and suitable control cards. Without buyer-level evidence, describe any divergence as consistent with shifting attention—not proof that the same dollars moved.
Know the card behind the player name
A player’s market contains many different markets. A high-population base rookie, a sought-after insert, a numbered parallel and an autograph have different supply, buyers and trading frequency. Even the same card in PSA 8 and PSA 10 can behave differently.
We should compare the same card, product, parallel and grade across time. We should also check whether a result changes when a suspicious sale is removed, or when a thin month is treated as missing instead of unchanged.

Tom Brady, 2000 Bowman Chrome #236 Base PSA 9: monthly medians and recorded sale counts in 2024 and 2025.
Scarcity deserves analysis of its own. A card that rarely sells may appear stable because there has been no new price discovery. That is not proof that a buyer would pay the old price today. Desirability and available buyers still matter.
A discount on a standard room does not automatically price a suite. In the same way, a base-card chart does not automatically value a scarce parallel or autograph. Start with the exact card and grade, examine comparable completed sales, look at sales frequency and competing inventory, then calculate likely net proceeds. The purpose of the month-end review is to improve the next decision, not to turn a seasonal average into a promised buying or selling date.
Legacy does not mean season-proof
Legacy players belong in the test too. Being retired does not establish that a player’s cards have no seasonal exposure. Conversely, we should not assume every card has a repeatable seasonal cycle. A widely traded Jordan rookie and a scarce Jordan autograph may have different buyers, sale frequency and responses to events.
MORE EXACT-CARD CHARTS
Michael Jordan, Kobe Bryant, Ken Griffey Jr. and LeBron James
Same charts: monthly median price and recorded sales, 2024 versus 2025.

Michael Jordan, 1986 Fleer #57 Base PSA 8: monthly medians and recorded sale counts in 2024 and 2025.

Kobe Bryant, 1996 Topps #138 Base PSA 10: monthly medians and recorded sales. These results do not price the Chrome Refractor.

Ken Griffey Jr., 1989 Upper Deck #1 Star Rookie PSA 10: every month of 2024 and 2025, with recorded sale counts.

LeBron James, 2003 Topps Chrome #111 Base PSA 9. LeBron was active during the study period, so this is not a retired-player control.
An apparent absence of movement can also mean an absence of sales. A scarce card with an old last-sale price has not necessarily held its executable value. We need fresh evidence before calling it resilient or seasonally unaffected.

The Manning BGS 9.5 and Kobe Chrome Refractor PSA 10 series are sparse. Missing transactions cannot establish unchanged value or a monthly seasonal pattern.
Price and liquidity answer different questions
Price asks what a card sold for. Liquidity asks how readily we can turn it into cash at an acceptable price. A month with fewer sales does not automatically mean lower prices, and higher total sales dollars do not automatically mean the same cards became more valuable.
Track transaction counts, days between sales, days since the last sale and competing inventory alongside the price. Where listing histories are available, track time to sale and the proportion of a defined listing cohort that actually sold.
For the 1986 Fleer #57 Michael Jordan Base PSA 8, the monthly median fell from $7,200 in September 2024 to $6,939 in October, about 3.6%. Recorded sales increased from 23 to 40. We can say that the median price was lower and more sales were recorded. We cannot infer that fewer buyers participated, that inventory sold faster or that the card was easier to sell at a chosen price. Those questions require additional evidence.

Jordan PSA 8, September–October 2024: median price fell from $7,200 to $6,939 while recorded sales increased from 23 to 40.
A clean-looking chart can hide old observations or modeled values. Platform documentation matters: indexes can change membership, while industry databases can expand their coverage. Our comparisons must account for those changes.
Events can matter more than the month
Preseason expectations, a playoff run, an injury, retirement or a major product release can all overlap a seasonal window. We should compare the same distance from an event across years and include the players who disappointed as well as those who won.
If football prices strengthen while basketball prices weaken, that may be consistent with attention shifting. It does not establish that the same buyers moved the same dollars. Both categories may also rise together in a stronger market.
An auction date is a pricing decision too
Before committing a card to auction, examine recent sales of that exact card and grade, competing lots, the venue’s relevant audience, consignment deadlines, fees and the sale format. A potential attention window is worth researching, but it does not guarantee enough bidders or a better result.

A timing test must distinguish listing day from closing day and account for time zone, card, format and fees. No best weekday was established here.
Where the venue permits a reserve or minimum, understand its terms and trade-offs. A fixed-price listing with offers provides a different balance of price control and speed. Neither format creates demand by itself. Compare likely net proceeds, time to sale and the possibility of no sale, rather than assuming the latest auction price must be repeated.
Waiting is also a decision with a cost. If current card-specific evidence weakens or cash is needed, “it might be seasonal” is not a reason to ignore those facts. The goal is to choose deliberately, not to tell every collector to hold or every seller to discount.
What this changes at Lyons Cards
For now, seasonality should tell us when to investigate and prepare. It should not automatically set a discount or a target return. We will use current exact-card sales and competing inventory to guide pricing, with confidence reduced when evidence is thin.

Build a month-end review around exact-card comparisons, market context, sales activity, costs and a documented decision.
Before a seasonal pattern goes into Gravity, it needs to repeat across years, survive a comparison with the broader market, and work in data that did not create the rule. It also needs to survive selling costs and the possibility that the card does not sell in the expected window.
Before you sell because of a headline, understand what the number measures. Ask about the season, the exact card, the broader market and the available buyers. A decline deserves investigation. It does not, by itself, predict the next decline—and seasonality does not, by itself, promise a rebound.
Next time on Living on the Edge, we’re digging into 2026, month by month. We’ll bring the hotel month-end mindset to cards: what changed, which exact cards moved, how much activity we can actually measure, and what needs more investigation. We’ll compare January through September as complete months and label October as month-to-date, with the cutoff clearly stated. Seasonality will be one explanation we test alongside the broader market, player news and new supply. And we’ll show how that review can help shape Gravity’s future pricing research.

Next episode: 2026 year to date, month by month. January–September are complete months; October is month-to-date with a stated cutoff. Research is planned.
RESEARCH NOTE
Source: the supplied Legacy Cards Monthly Study 2024–2025 and its monthly aggregate JSON, retrieved October 14, 2026 from Card Ladder’s recorded All Sales data according to the study. Charts were rebuilt from those aggregates for this article. Records are not modeled values, active asking prices or a complete settlement audit. Displayed-text and image-reference deduplication was used; a complete transaction-ID audit remains unfinished. Market Movers replication and a suitable fixed broad-market benchmark remain incomplete.
The five frequent-series graphs include every calendar month in both years. Monthly percentage changes require at least five recorded sales in both months; January 2024 lacks a December 2023 baseline. Counts measure recorded activity, not unique buyers, inventory, sell-through or time to sale. Two years are exploratory and do not meet the original goal of at least three complete years.
SOURCES
Source links for the article. Links open in a new tab.
[1] Original Geoff Wilson episode
[2] NRF school-shopping research
[3] Supplementary monthly index
[4] Card Ladder methodology and coverage
[5] Cape Cod Chamber: seasons
[6] NYC Tourism: 2024 Travel & Tourism Trend Report
[7] Topps Flagship Football: official availability and player description
[8] Bowman Football: official availability
[9] Topps Flagship Basketball: preorder
[10] Topps Flagship Basketball: stated street date
[11] HobbyMonitor: modeled print-run estimates


FROM MARKET INTELLIGENCE TO PORTFOLIO STRATEGY
YOUR CARDS ARE ASSETS. MANAGE THEM THAT WAY.
Revenue-management discipline applied to individual cards and collections, evaluating when to sell, hold, grade, take live, watch or pass.
SELL • HOLD • GRADE • LIVE • WATCH • PASS